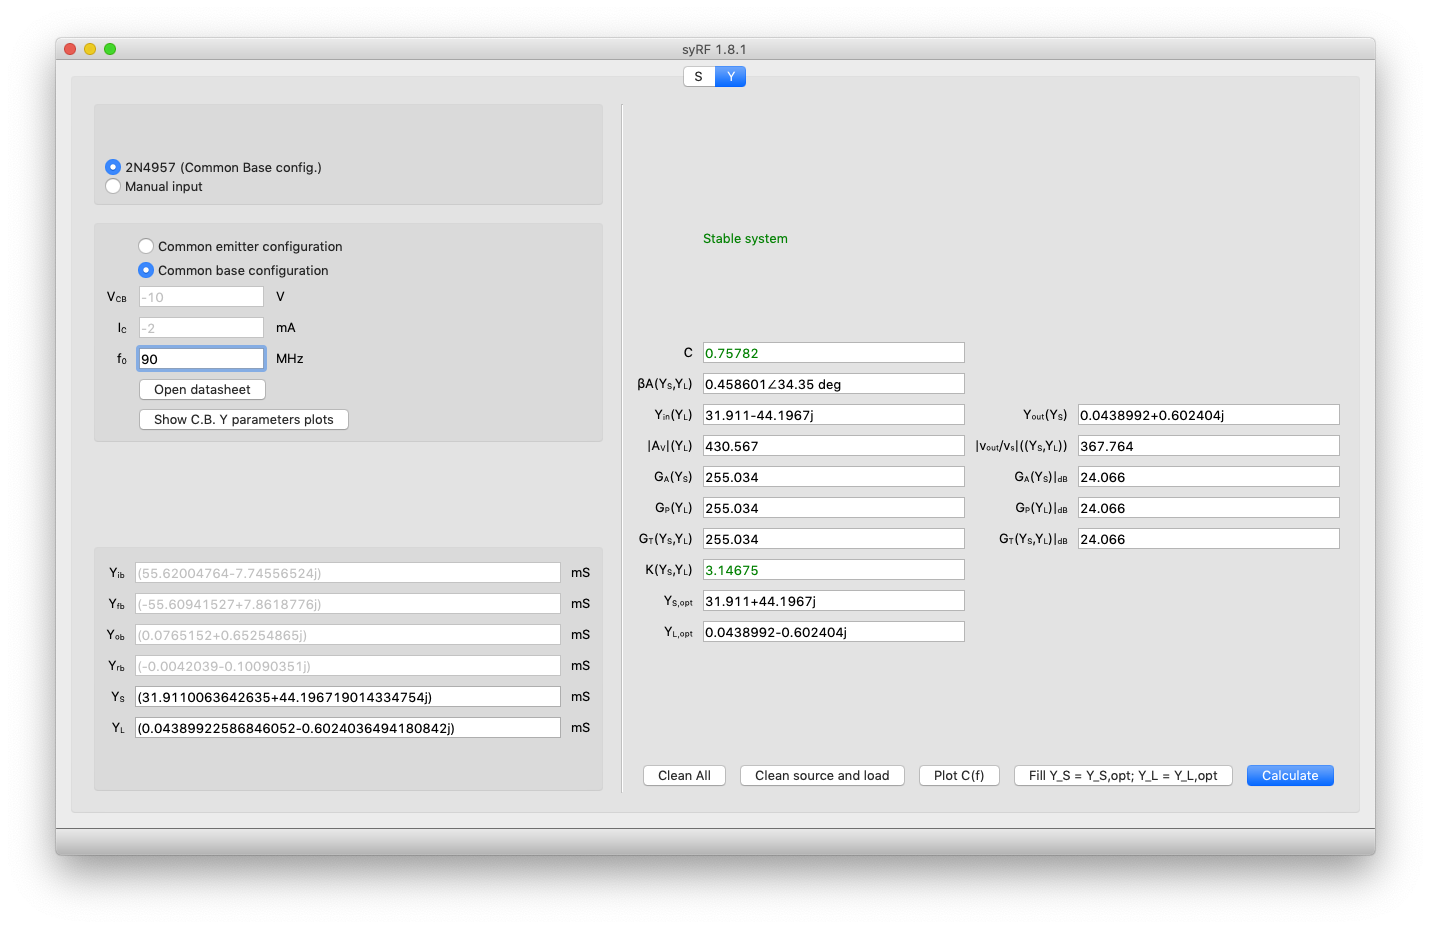
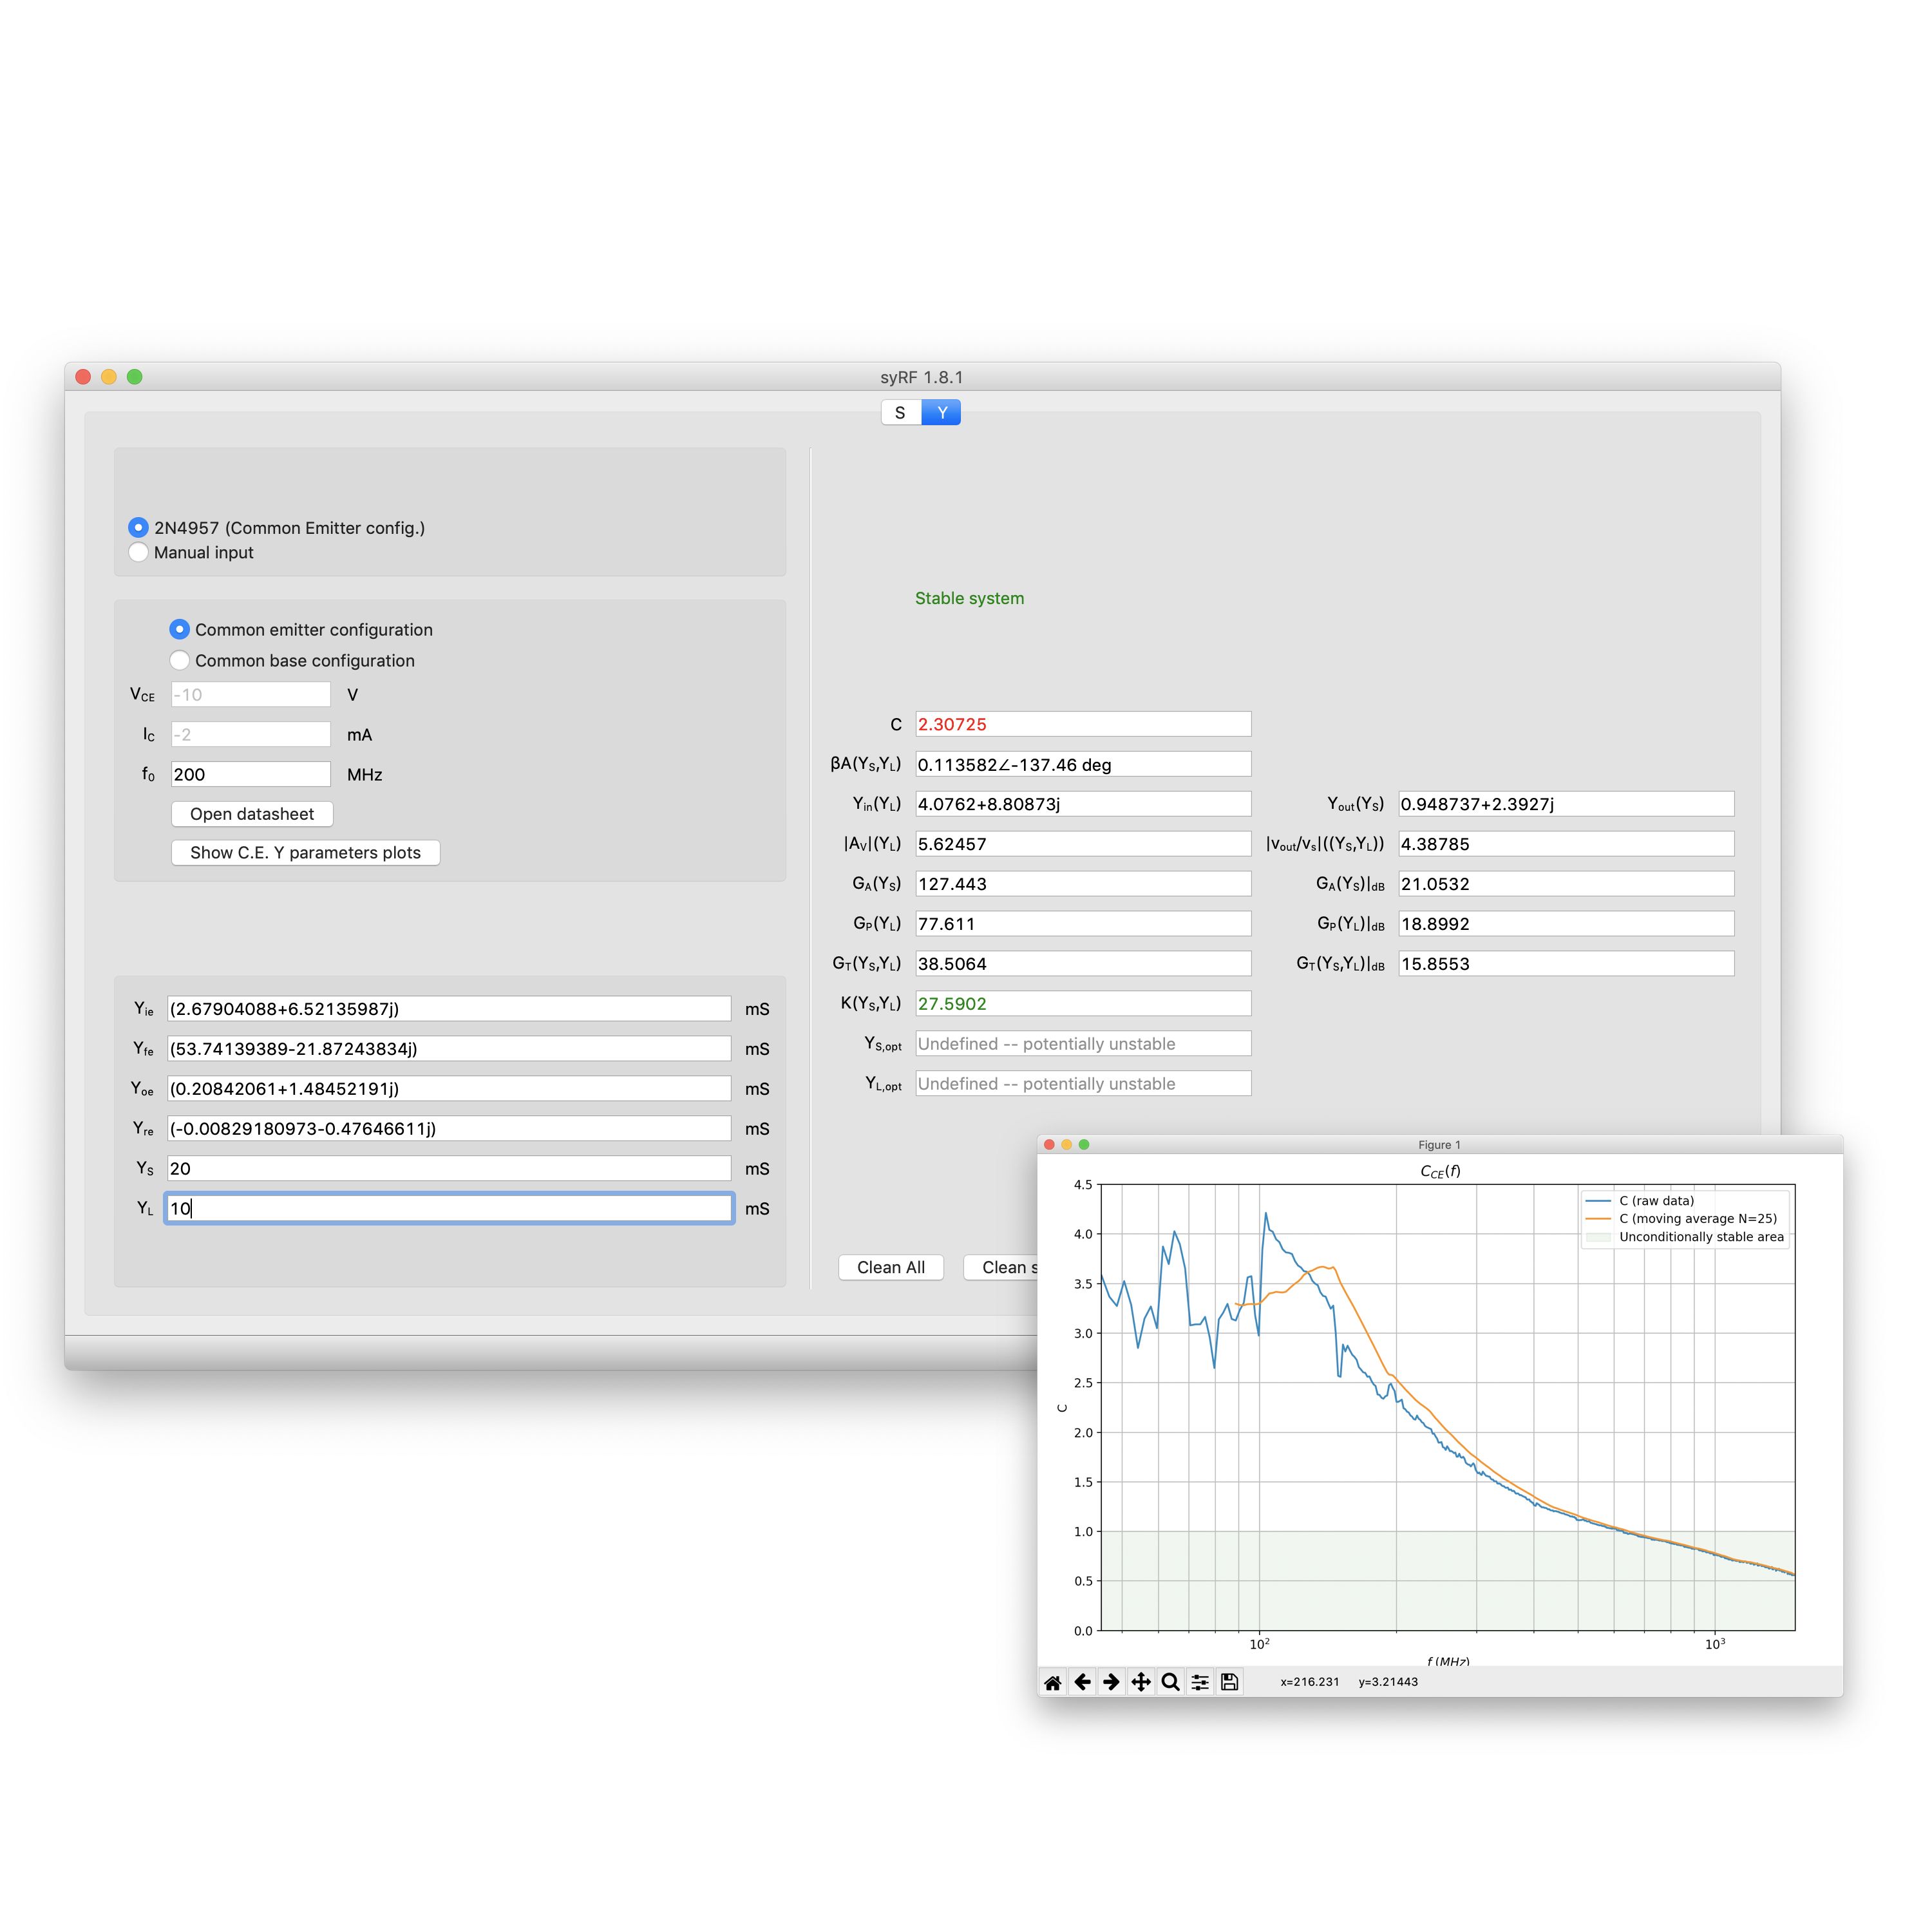
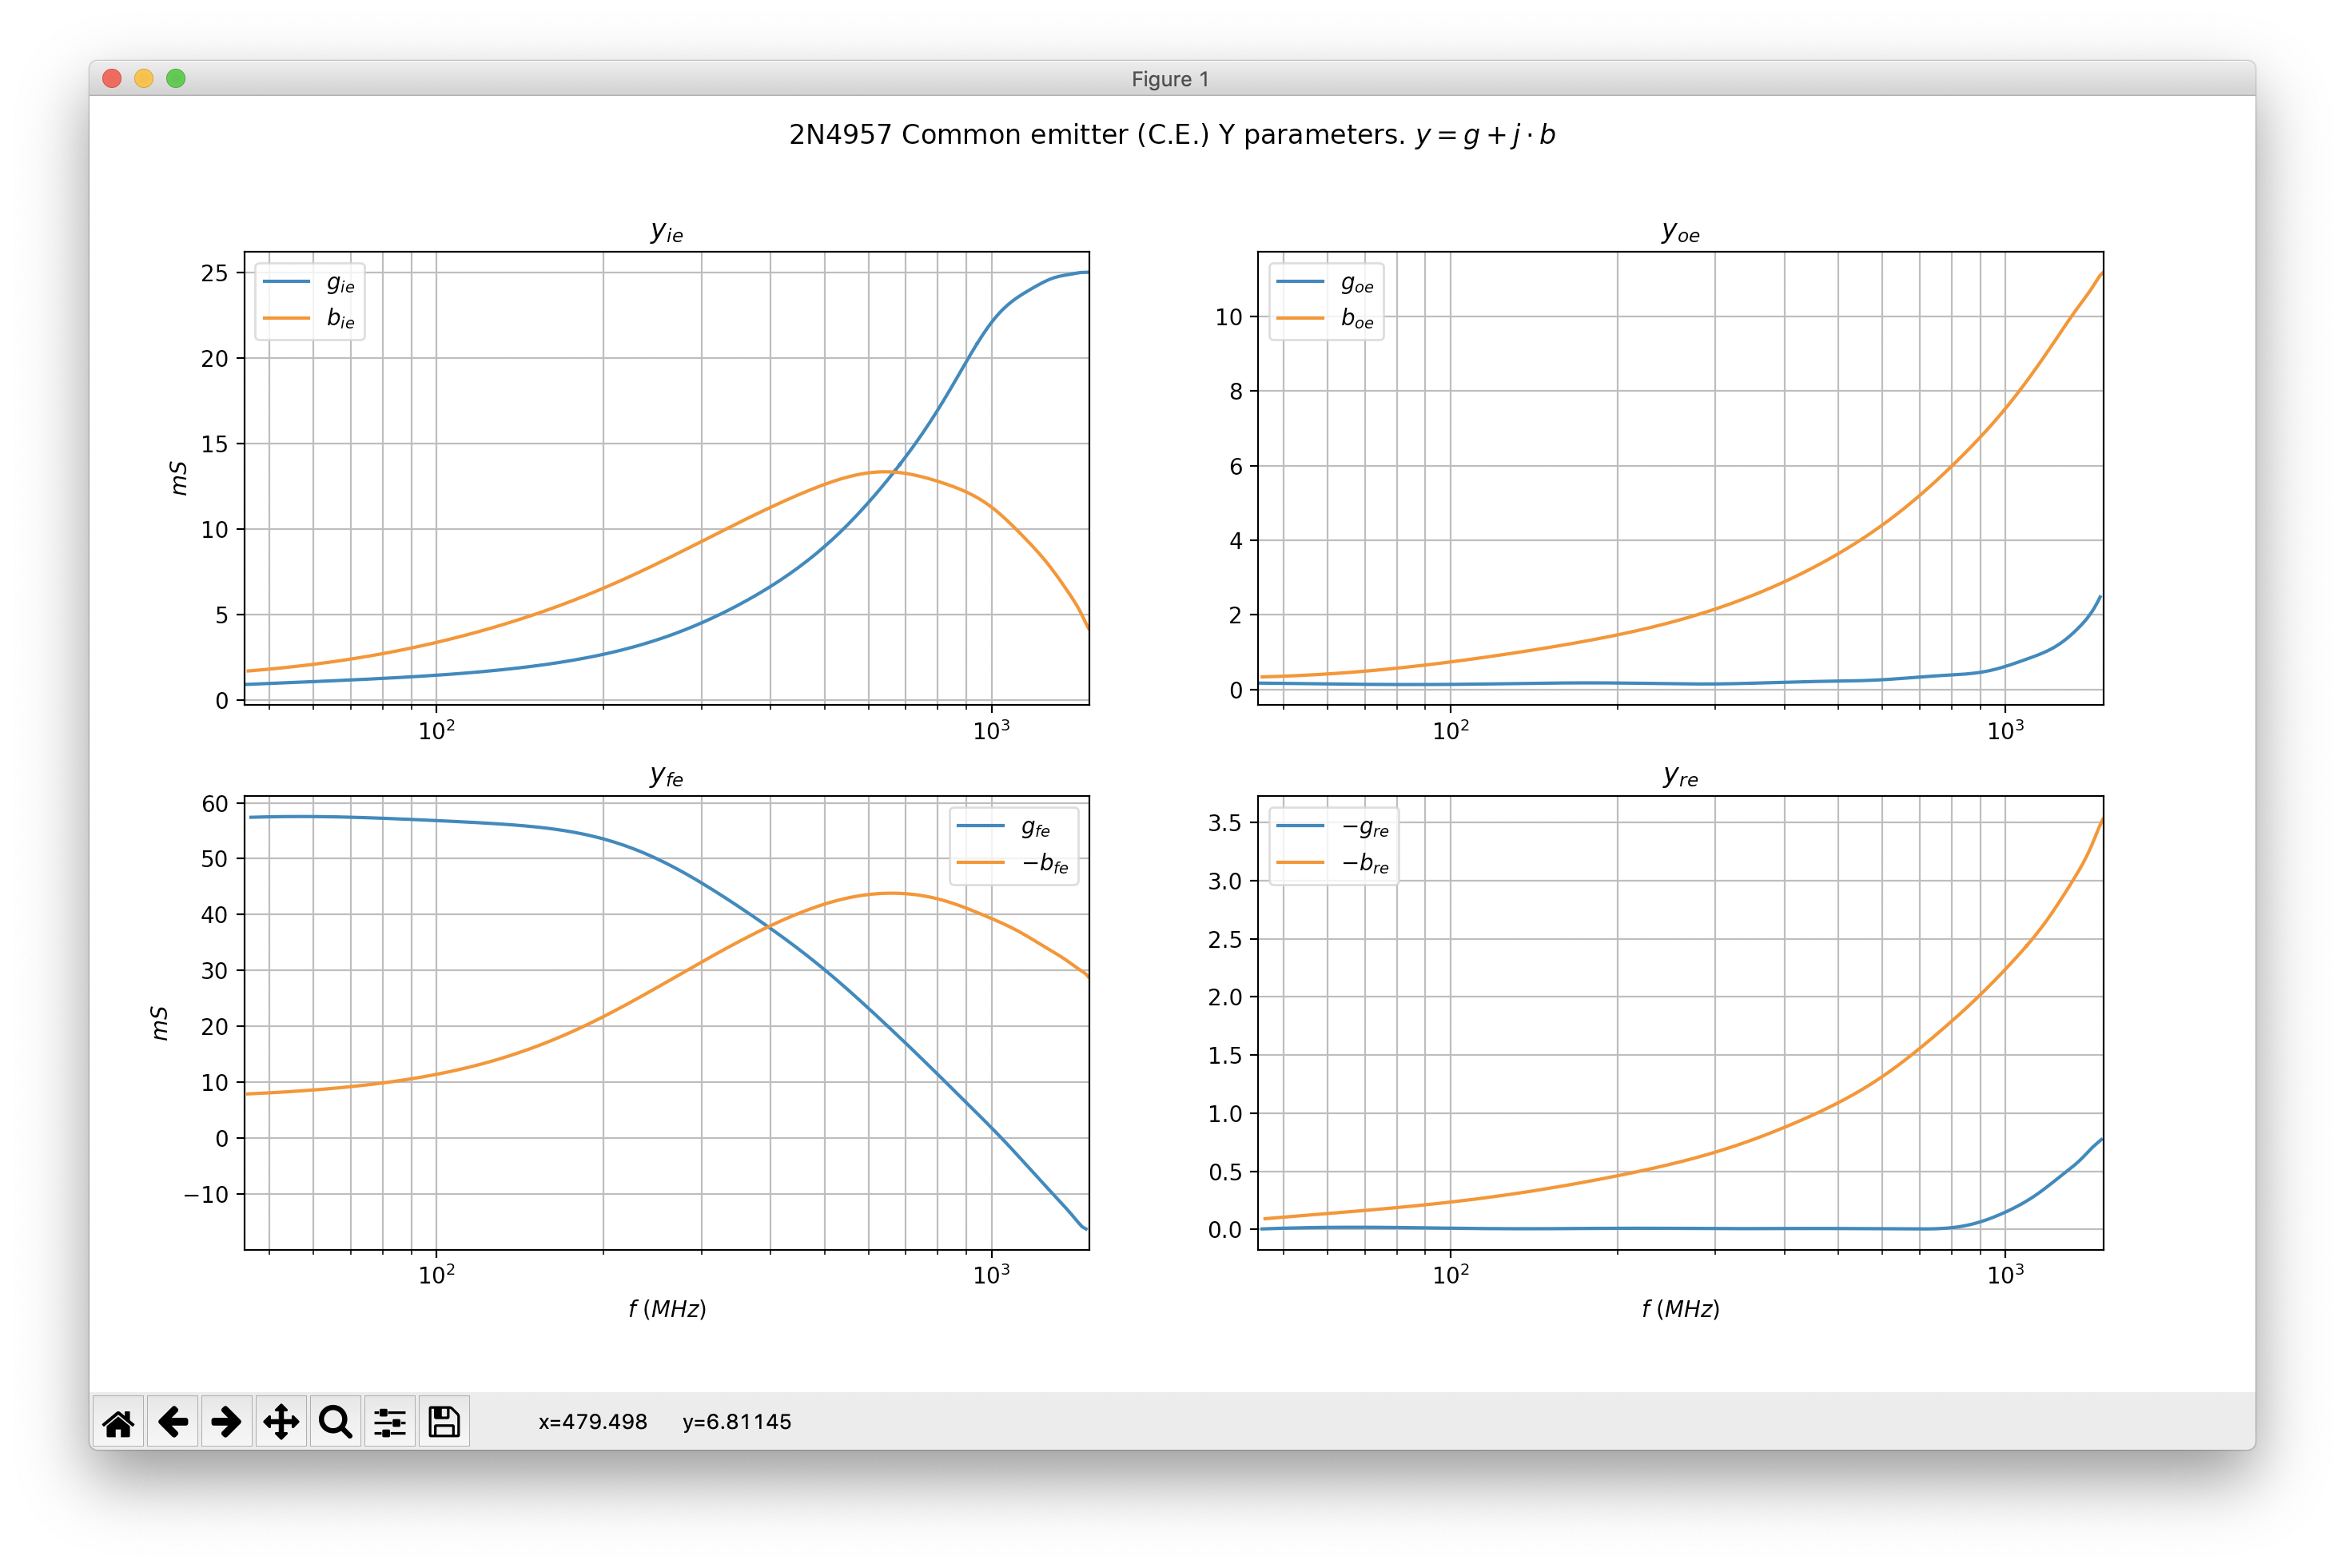
Y parameters
— Either manually insert the Y parameters or just type the Q point of the 2N4957 pnp transistor and let the software compute them for you.
— Open the Y parameters plots with Matplotlib and read the precise values hovering them with the cursor.
— Compute calculations such as βA and vout/vs and many more instantaneously, right after the data upon which they depend is filled.
— Provide, when the system is unconditionally stable, the optimum source and load impedances and print the maximum gains achievable.
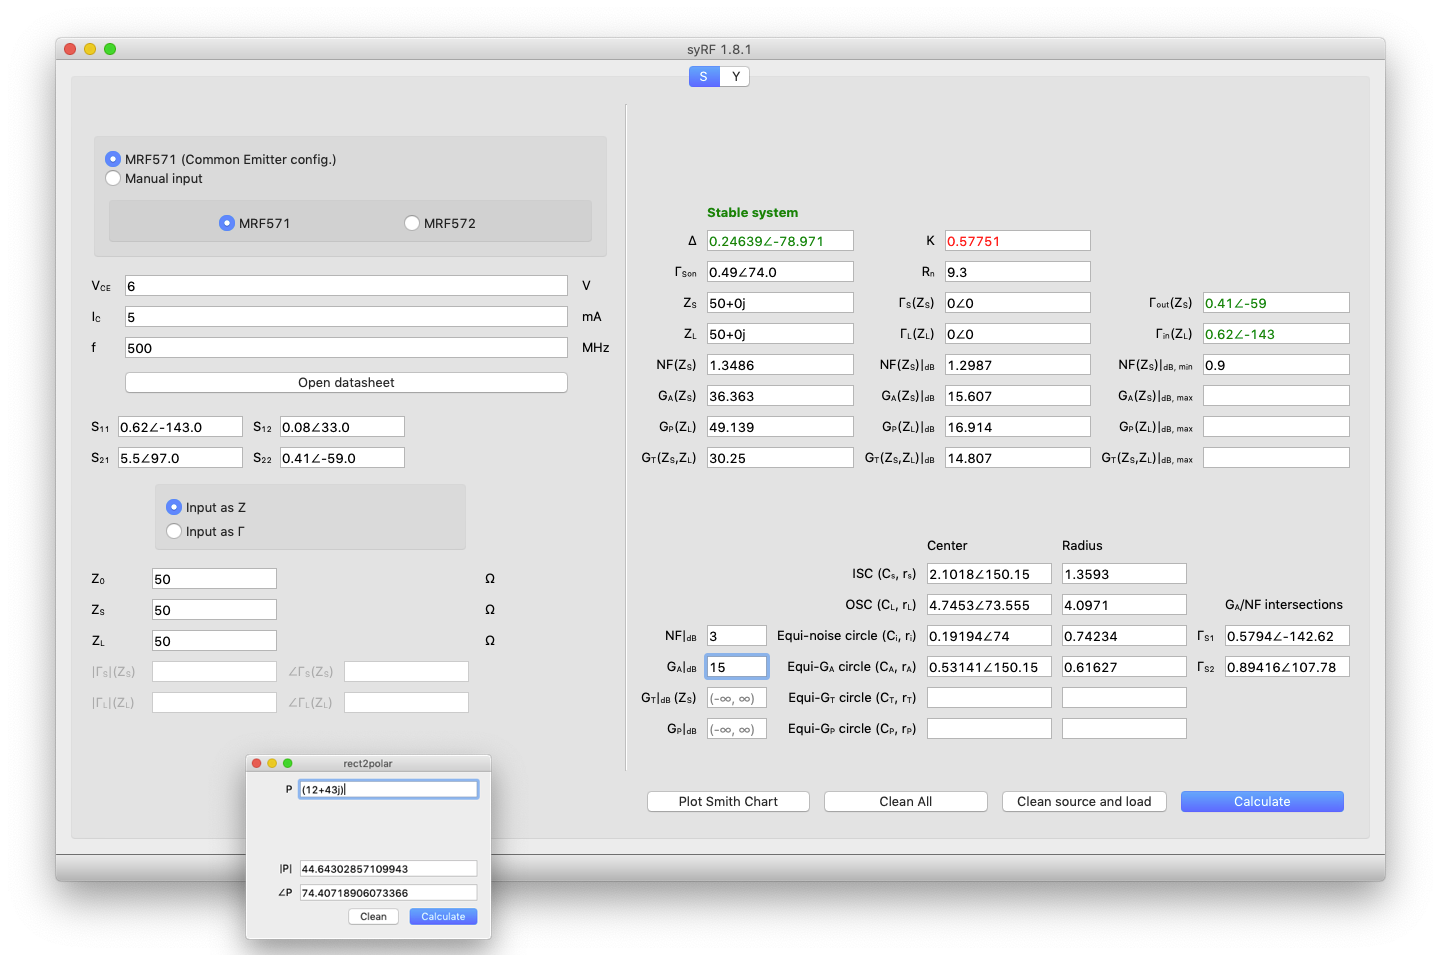
S parameters
— Either manually insert the S parameters or just type the Q point of the MRF571 or MRF572 transistors and let the software compute them for you.
— If provided on the datasheet, also fills noise parameters such as NFMIN, ΓS,ON, Rn.
— Compute calculations such as GA, GP, GT instantaneously.
— Provide, when the system is unconditionally stable, the optimum source and load impedances and instantly show the maximum gains achievable.
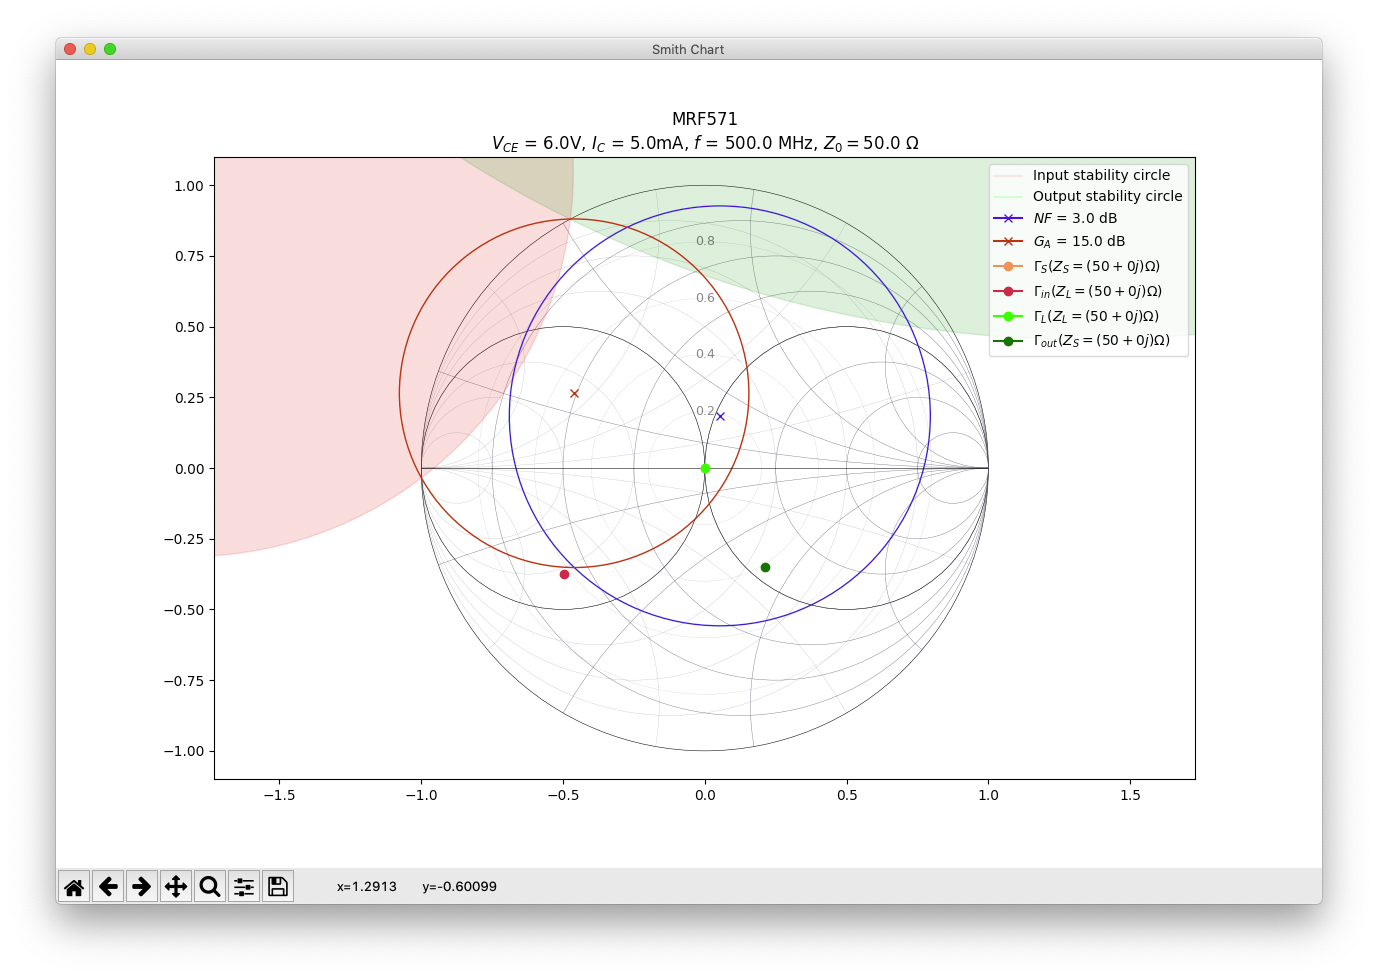
— Visualize the Smith Plot in a tidy and clean fashion.
— Automatically compute, when possible, the intersection between the equi-GA and the equi-NF circumferences.
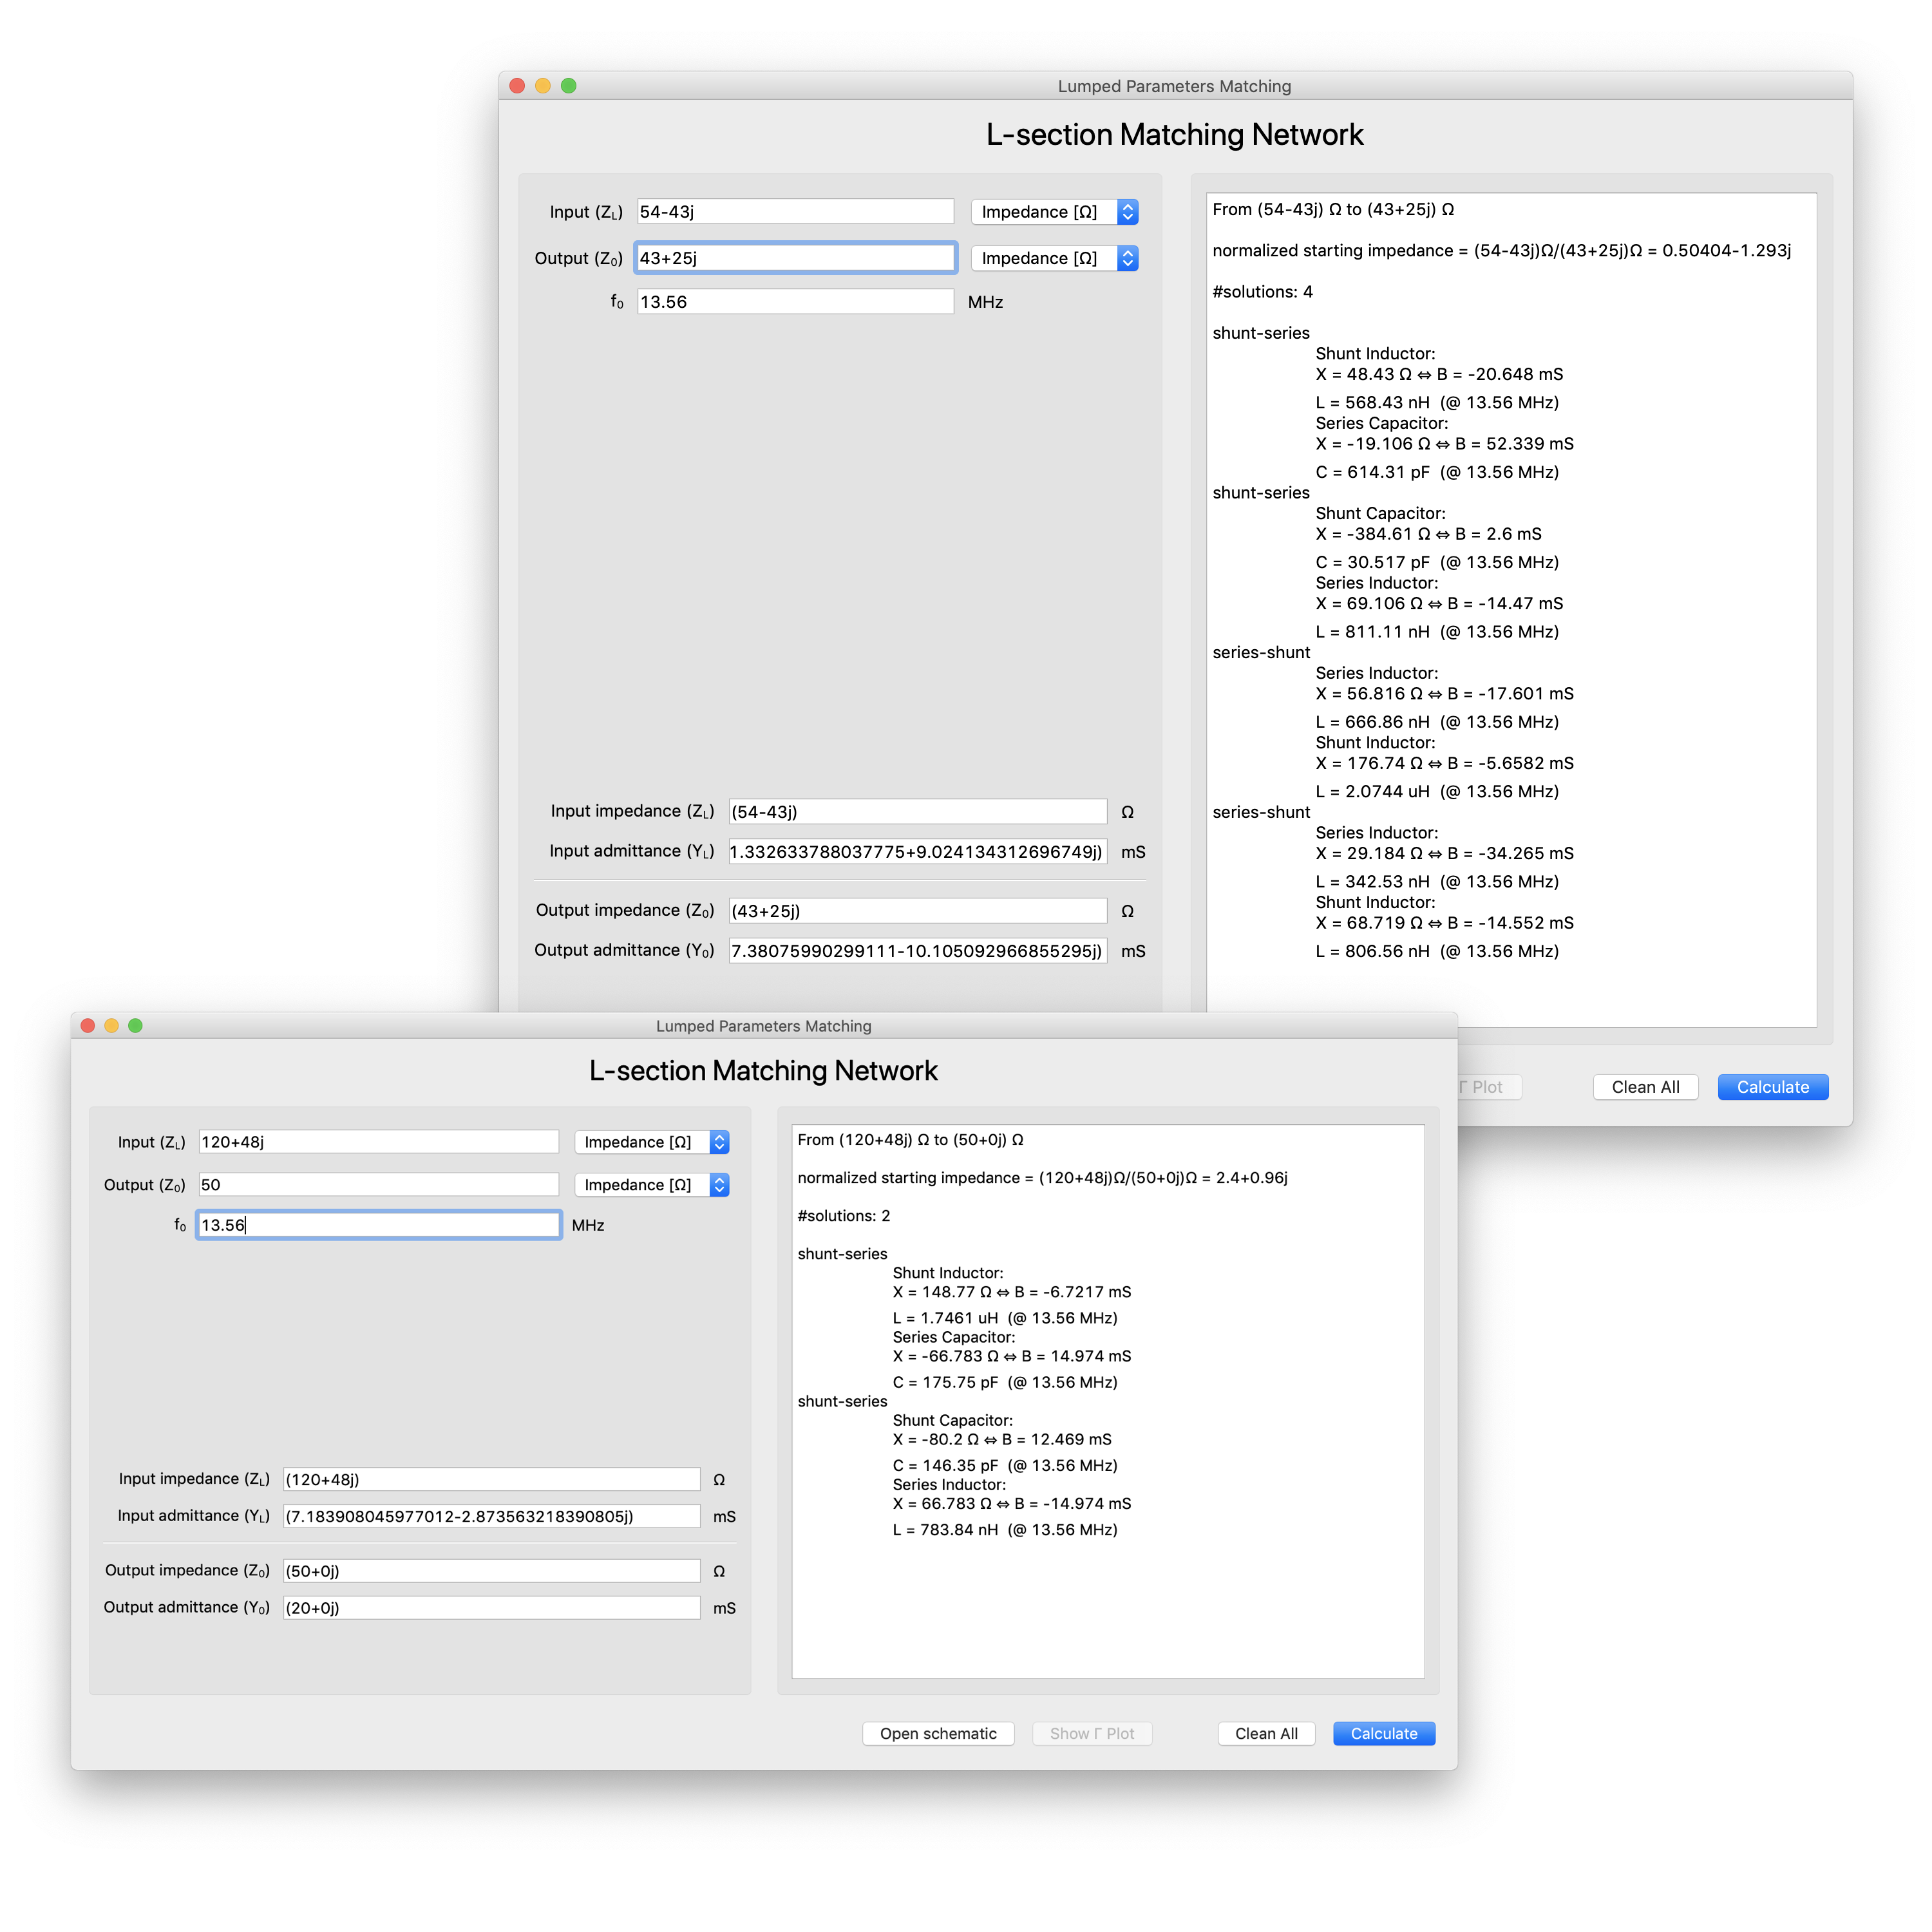
Matching networks
Lumped parameters
— Open Notebook here
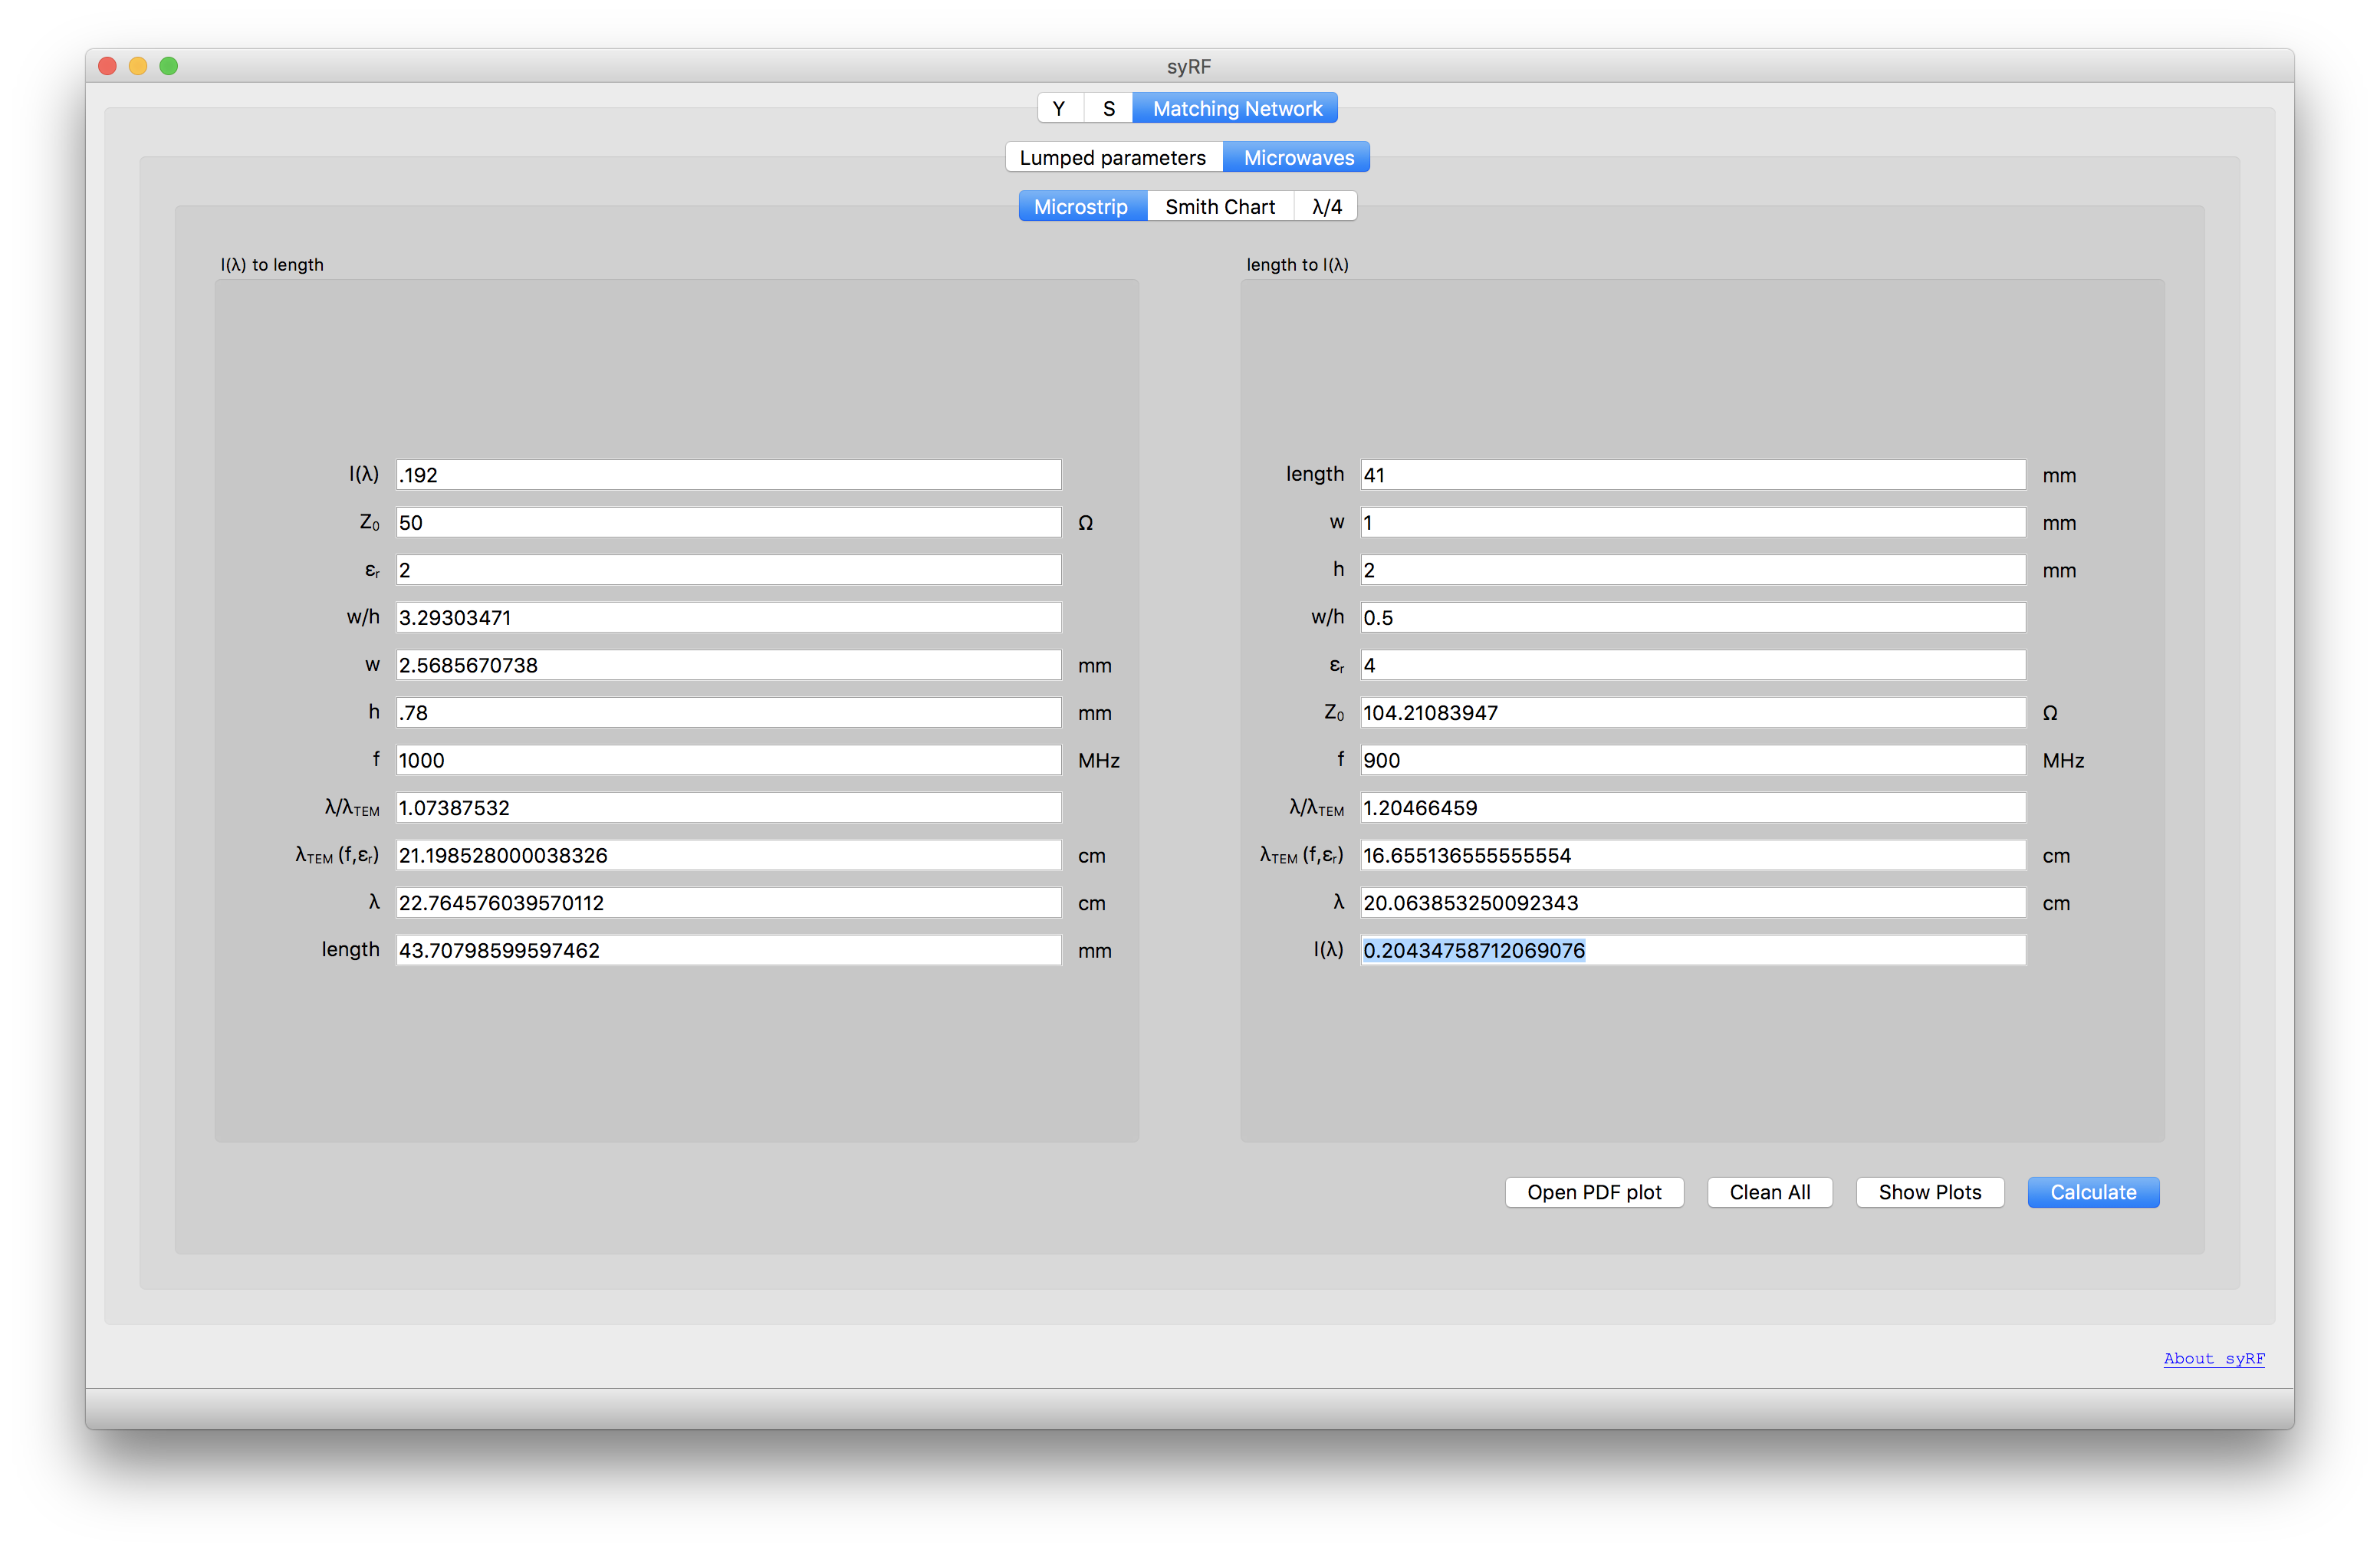
— Determine some matching parameters both using lumped elements (L-section) and microstrip matching.
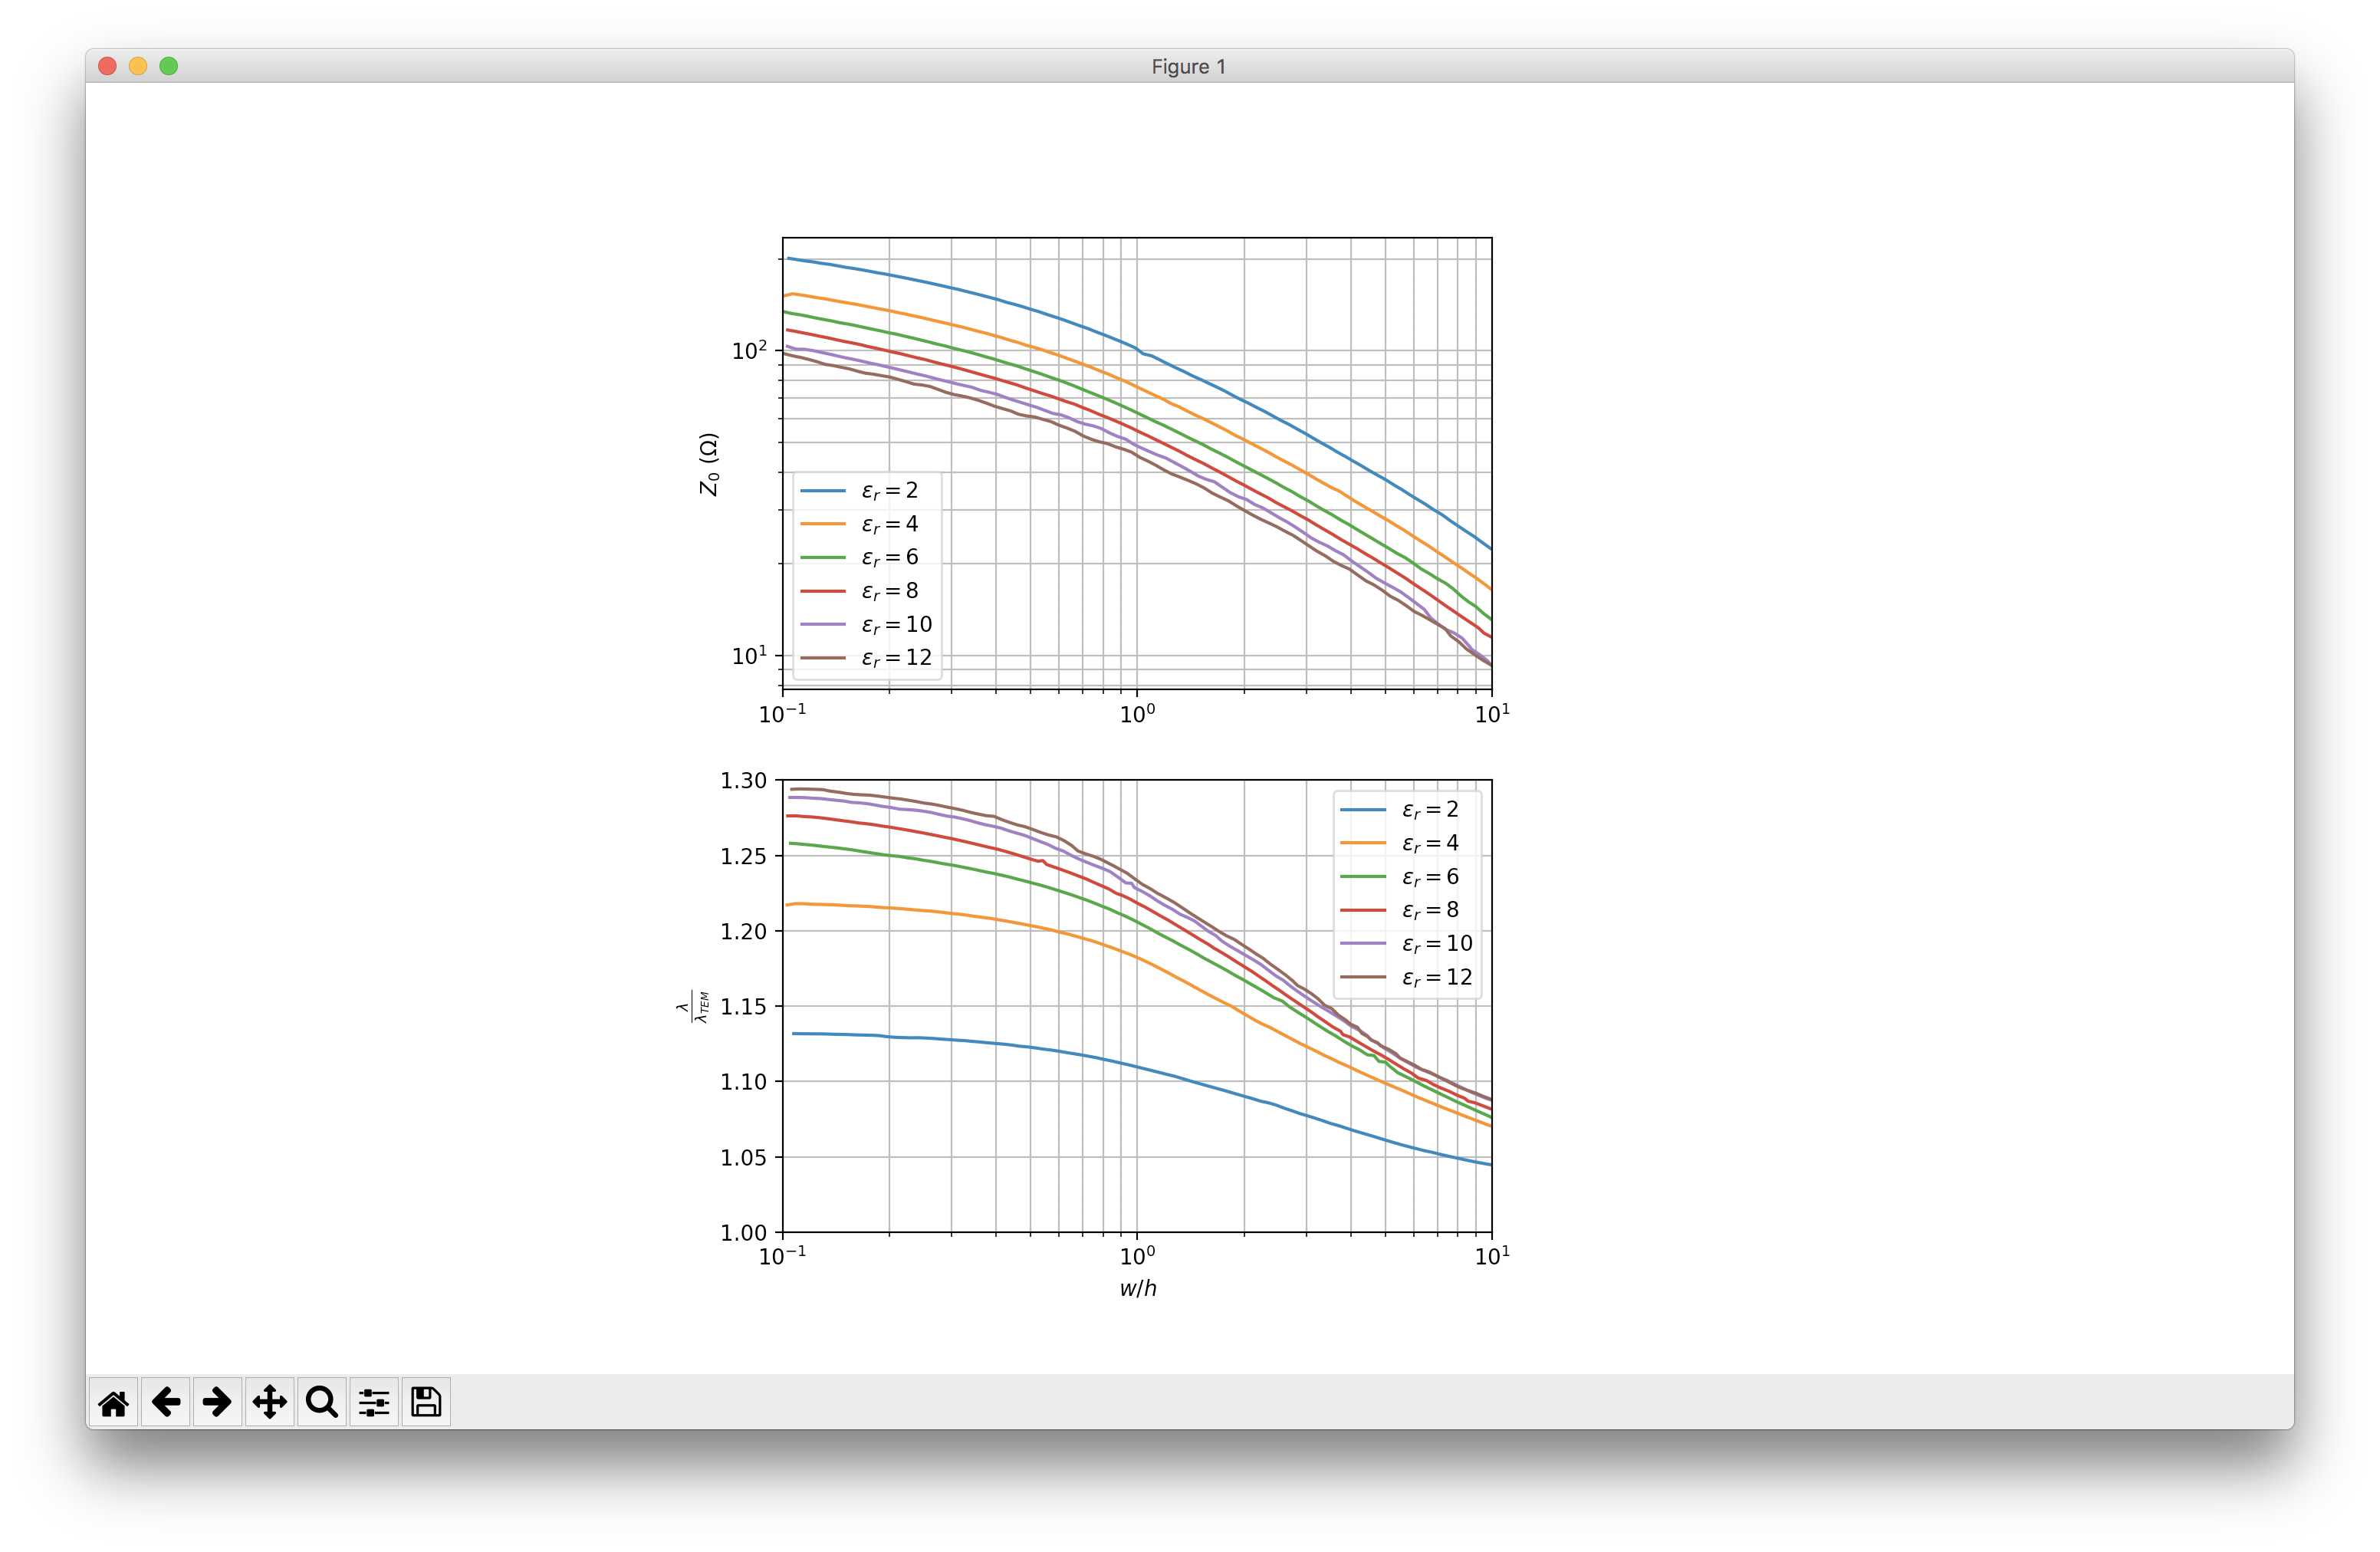
— Retrieve data from the respective plots (which can be visualized using Matplotlib) and compute the actual length of the microstrip right away.
Distributed parameters
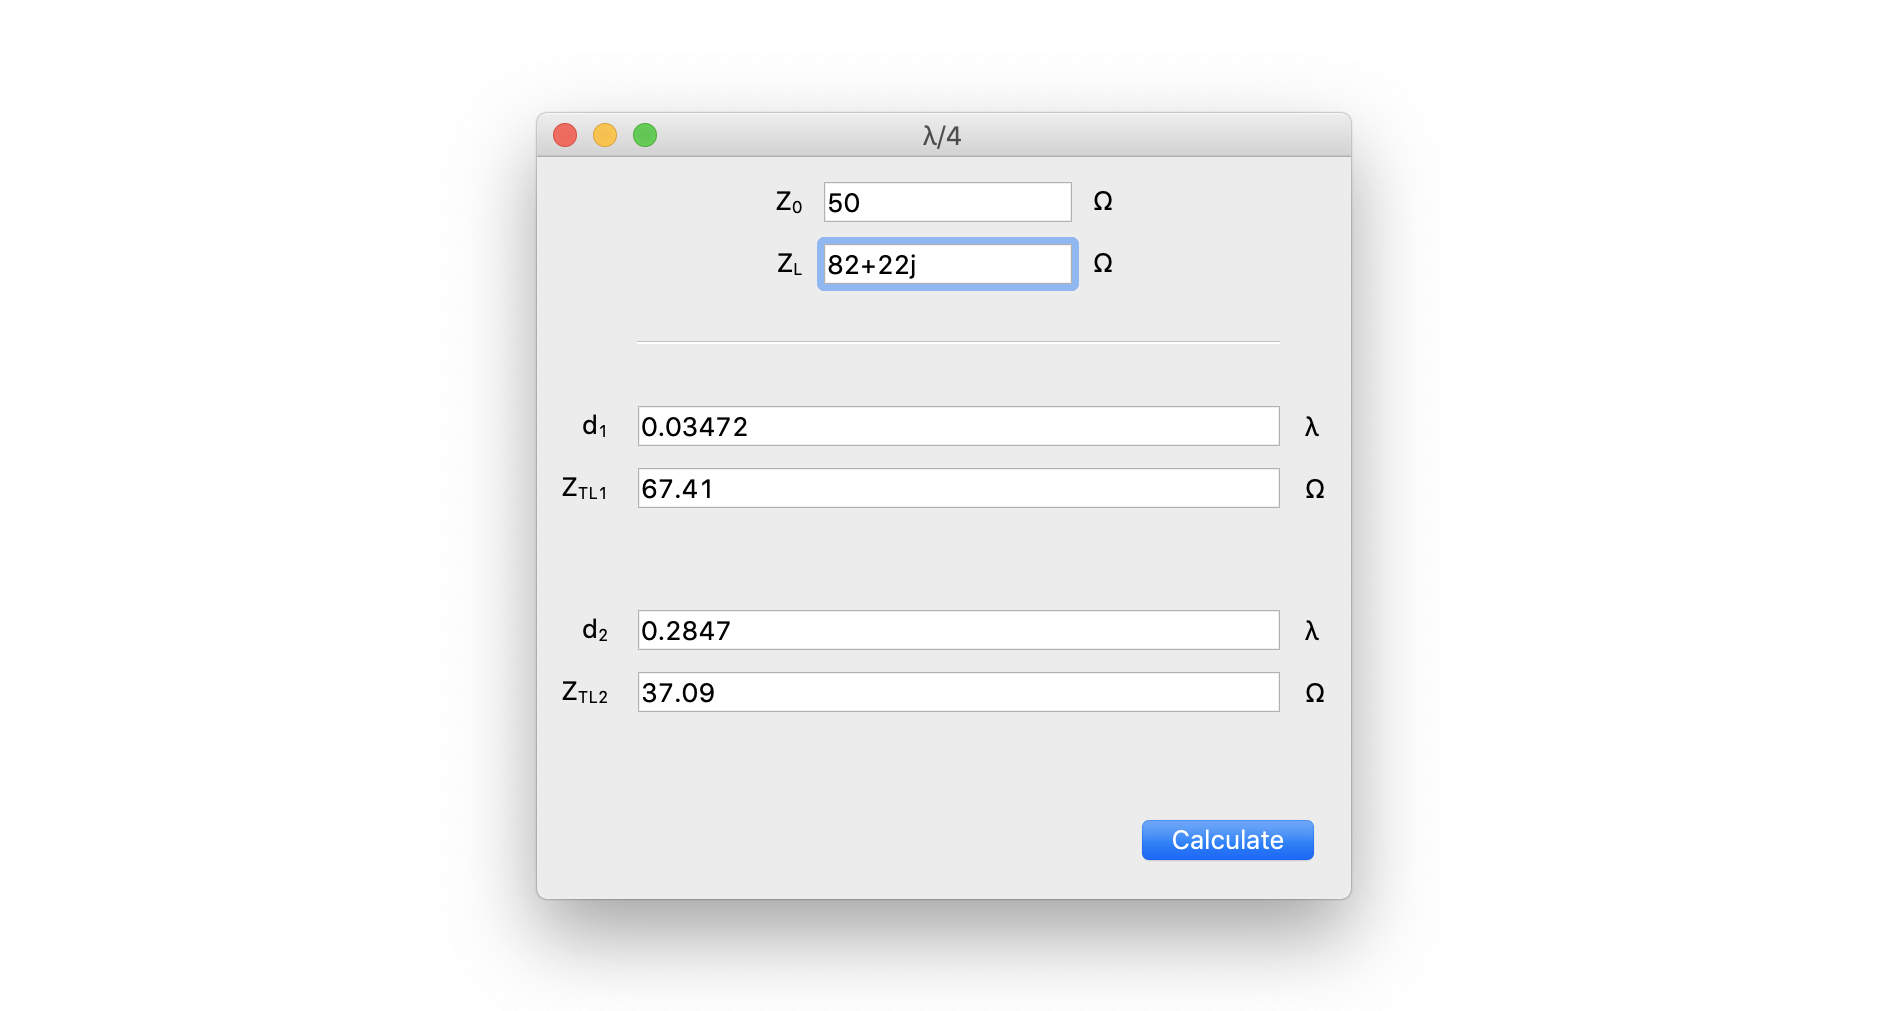
λ/4 impedance transformer
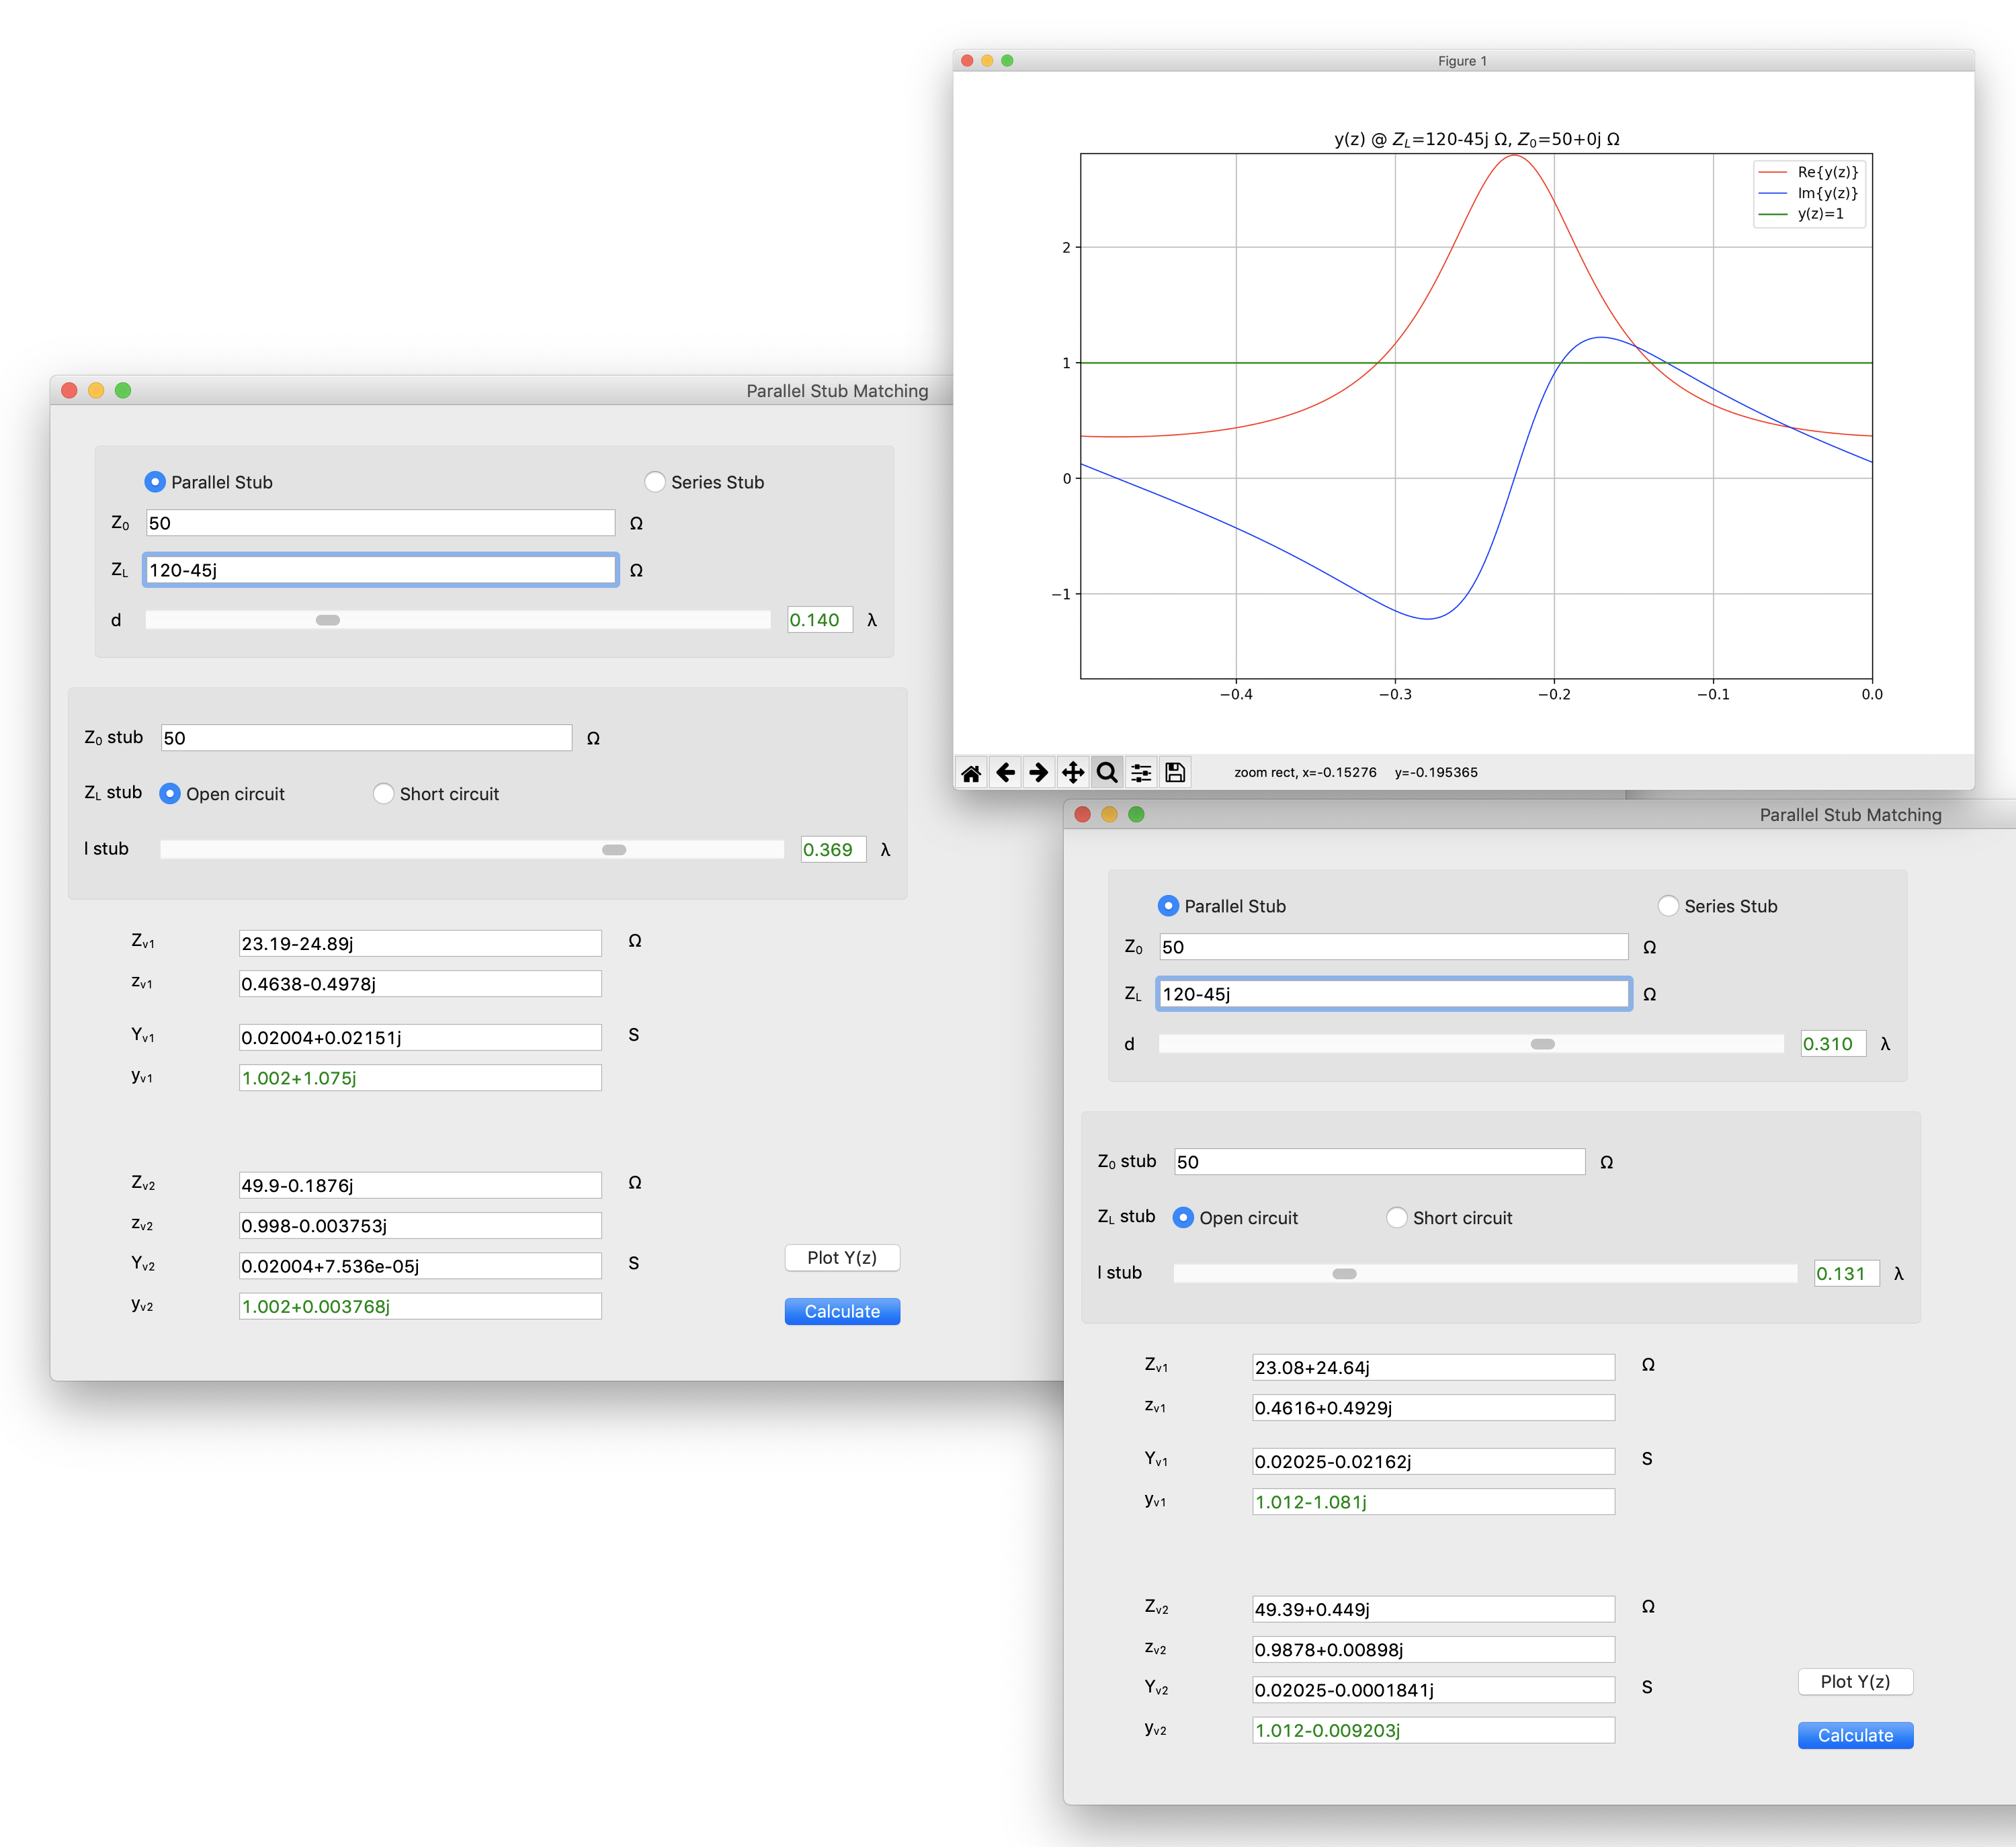
Stubs
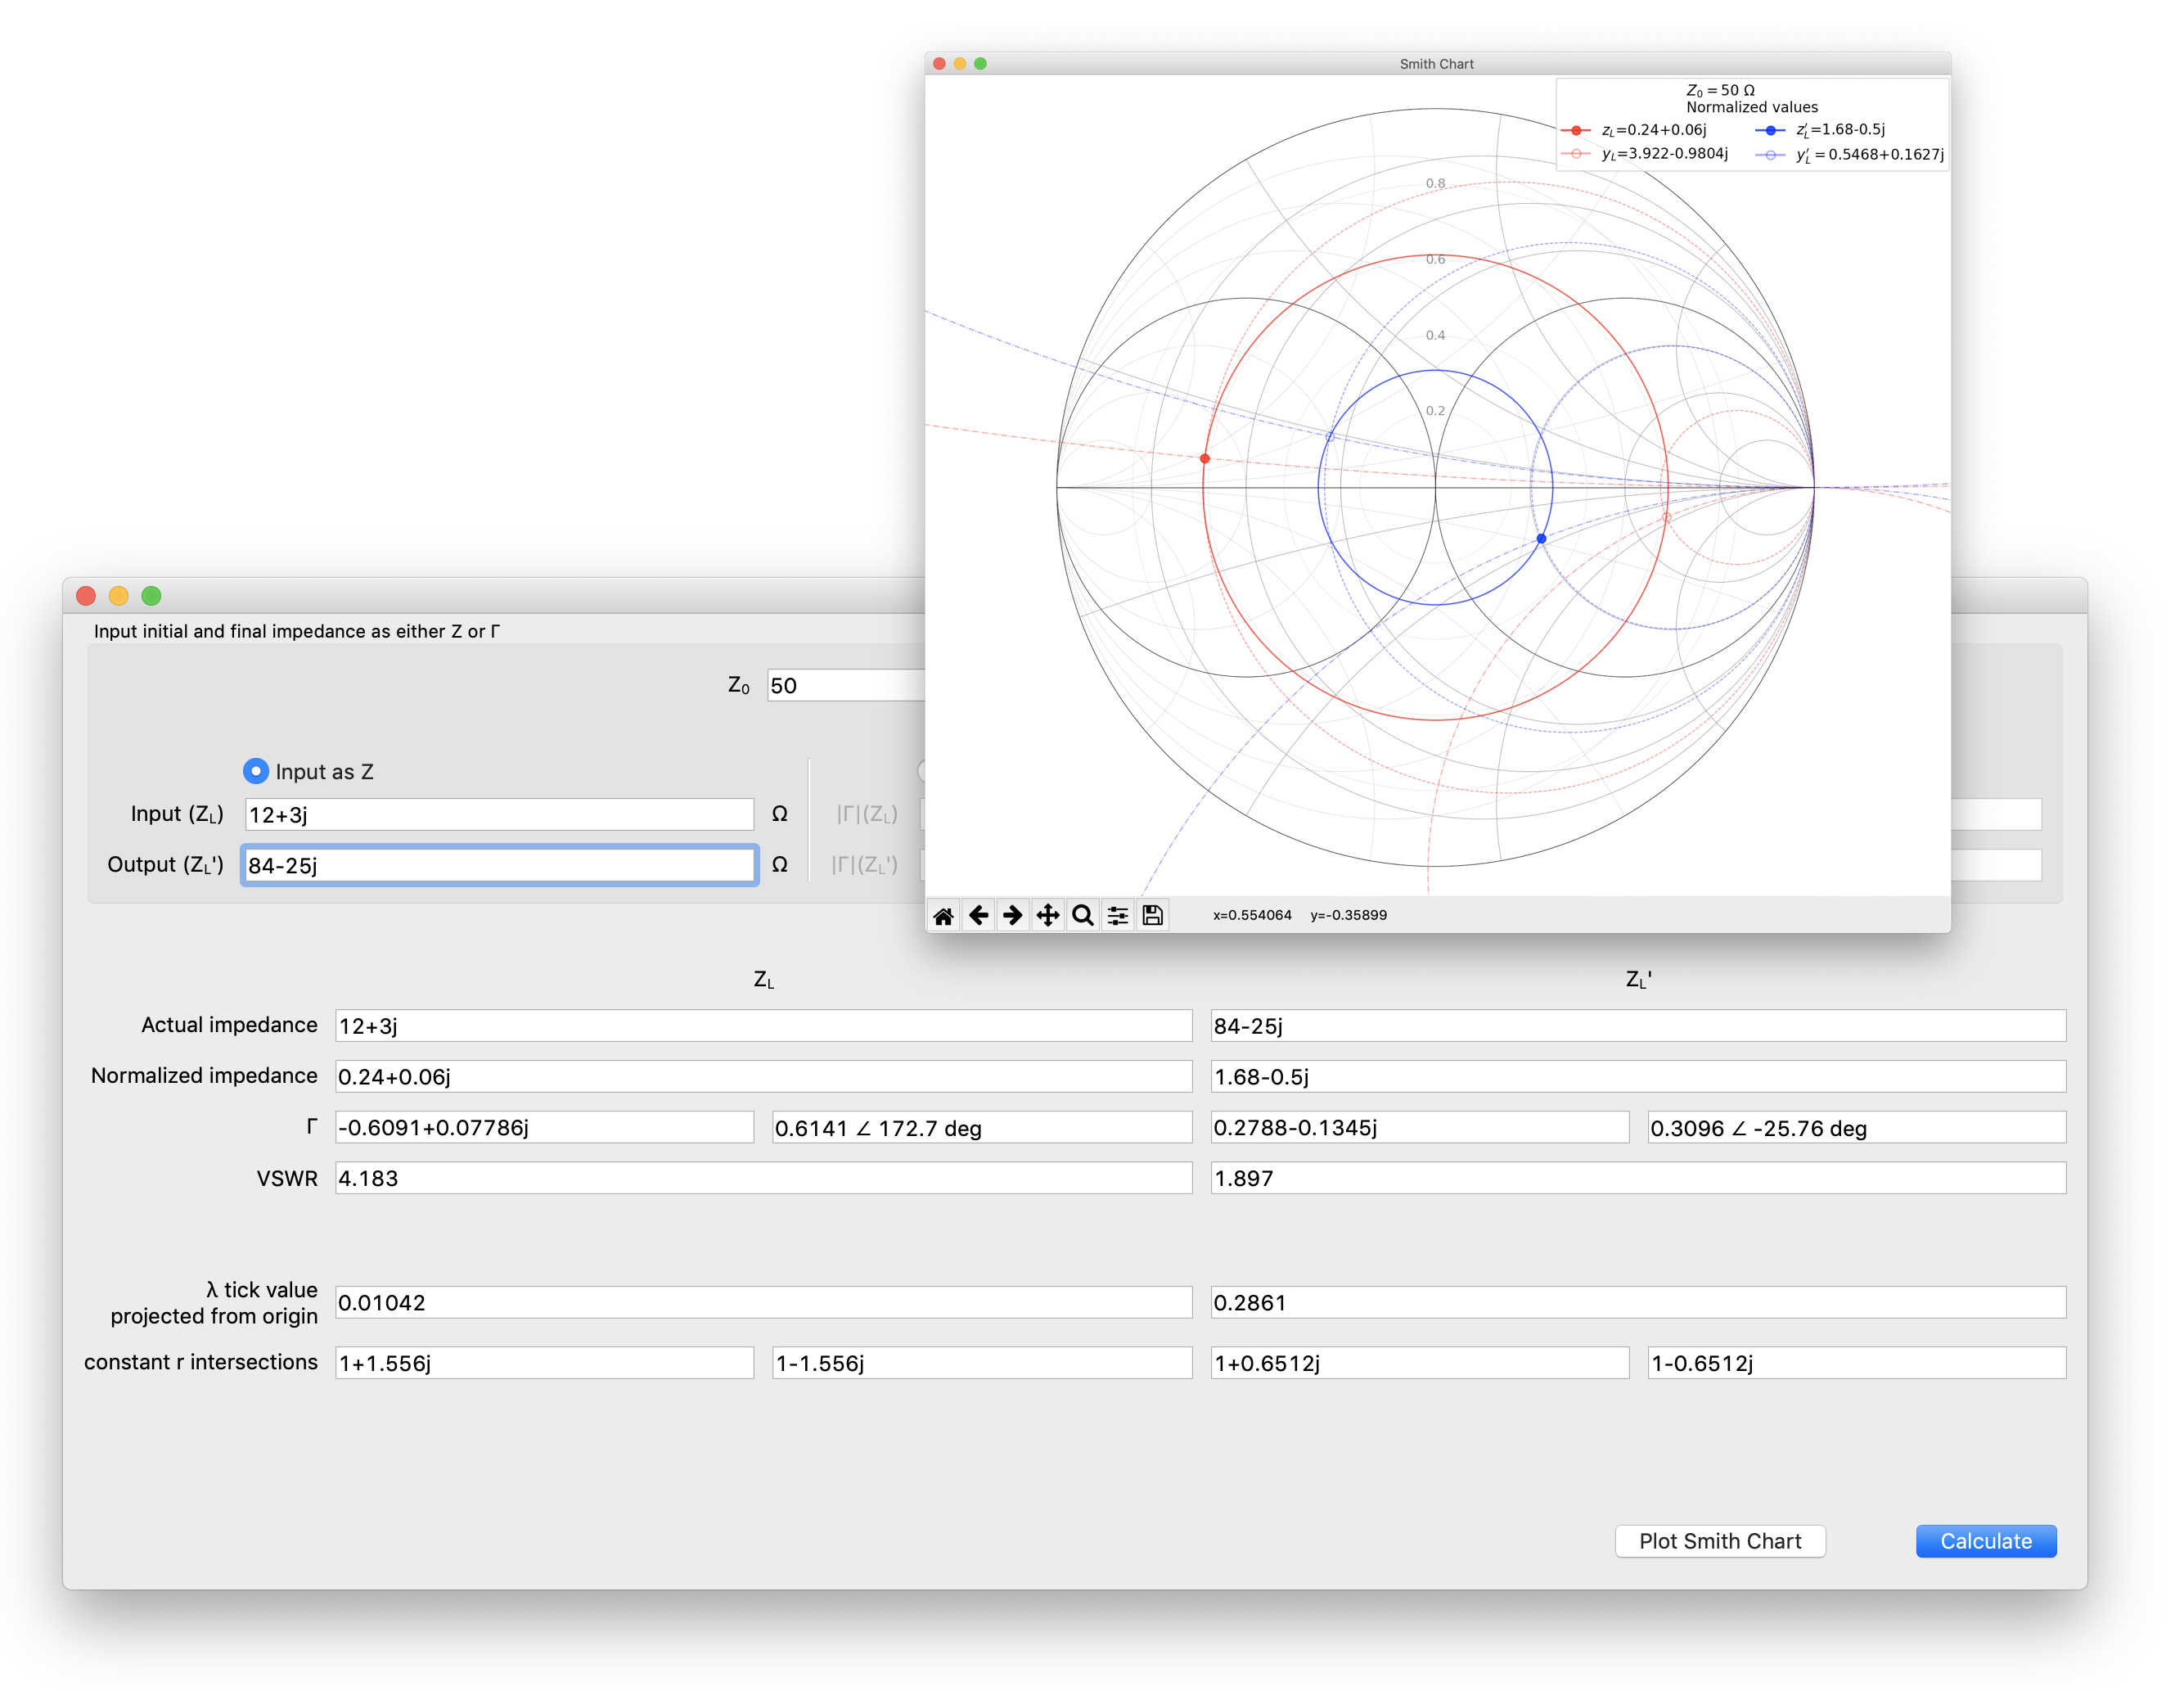
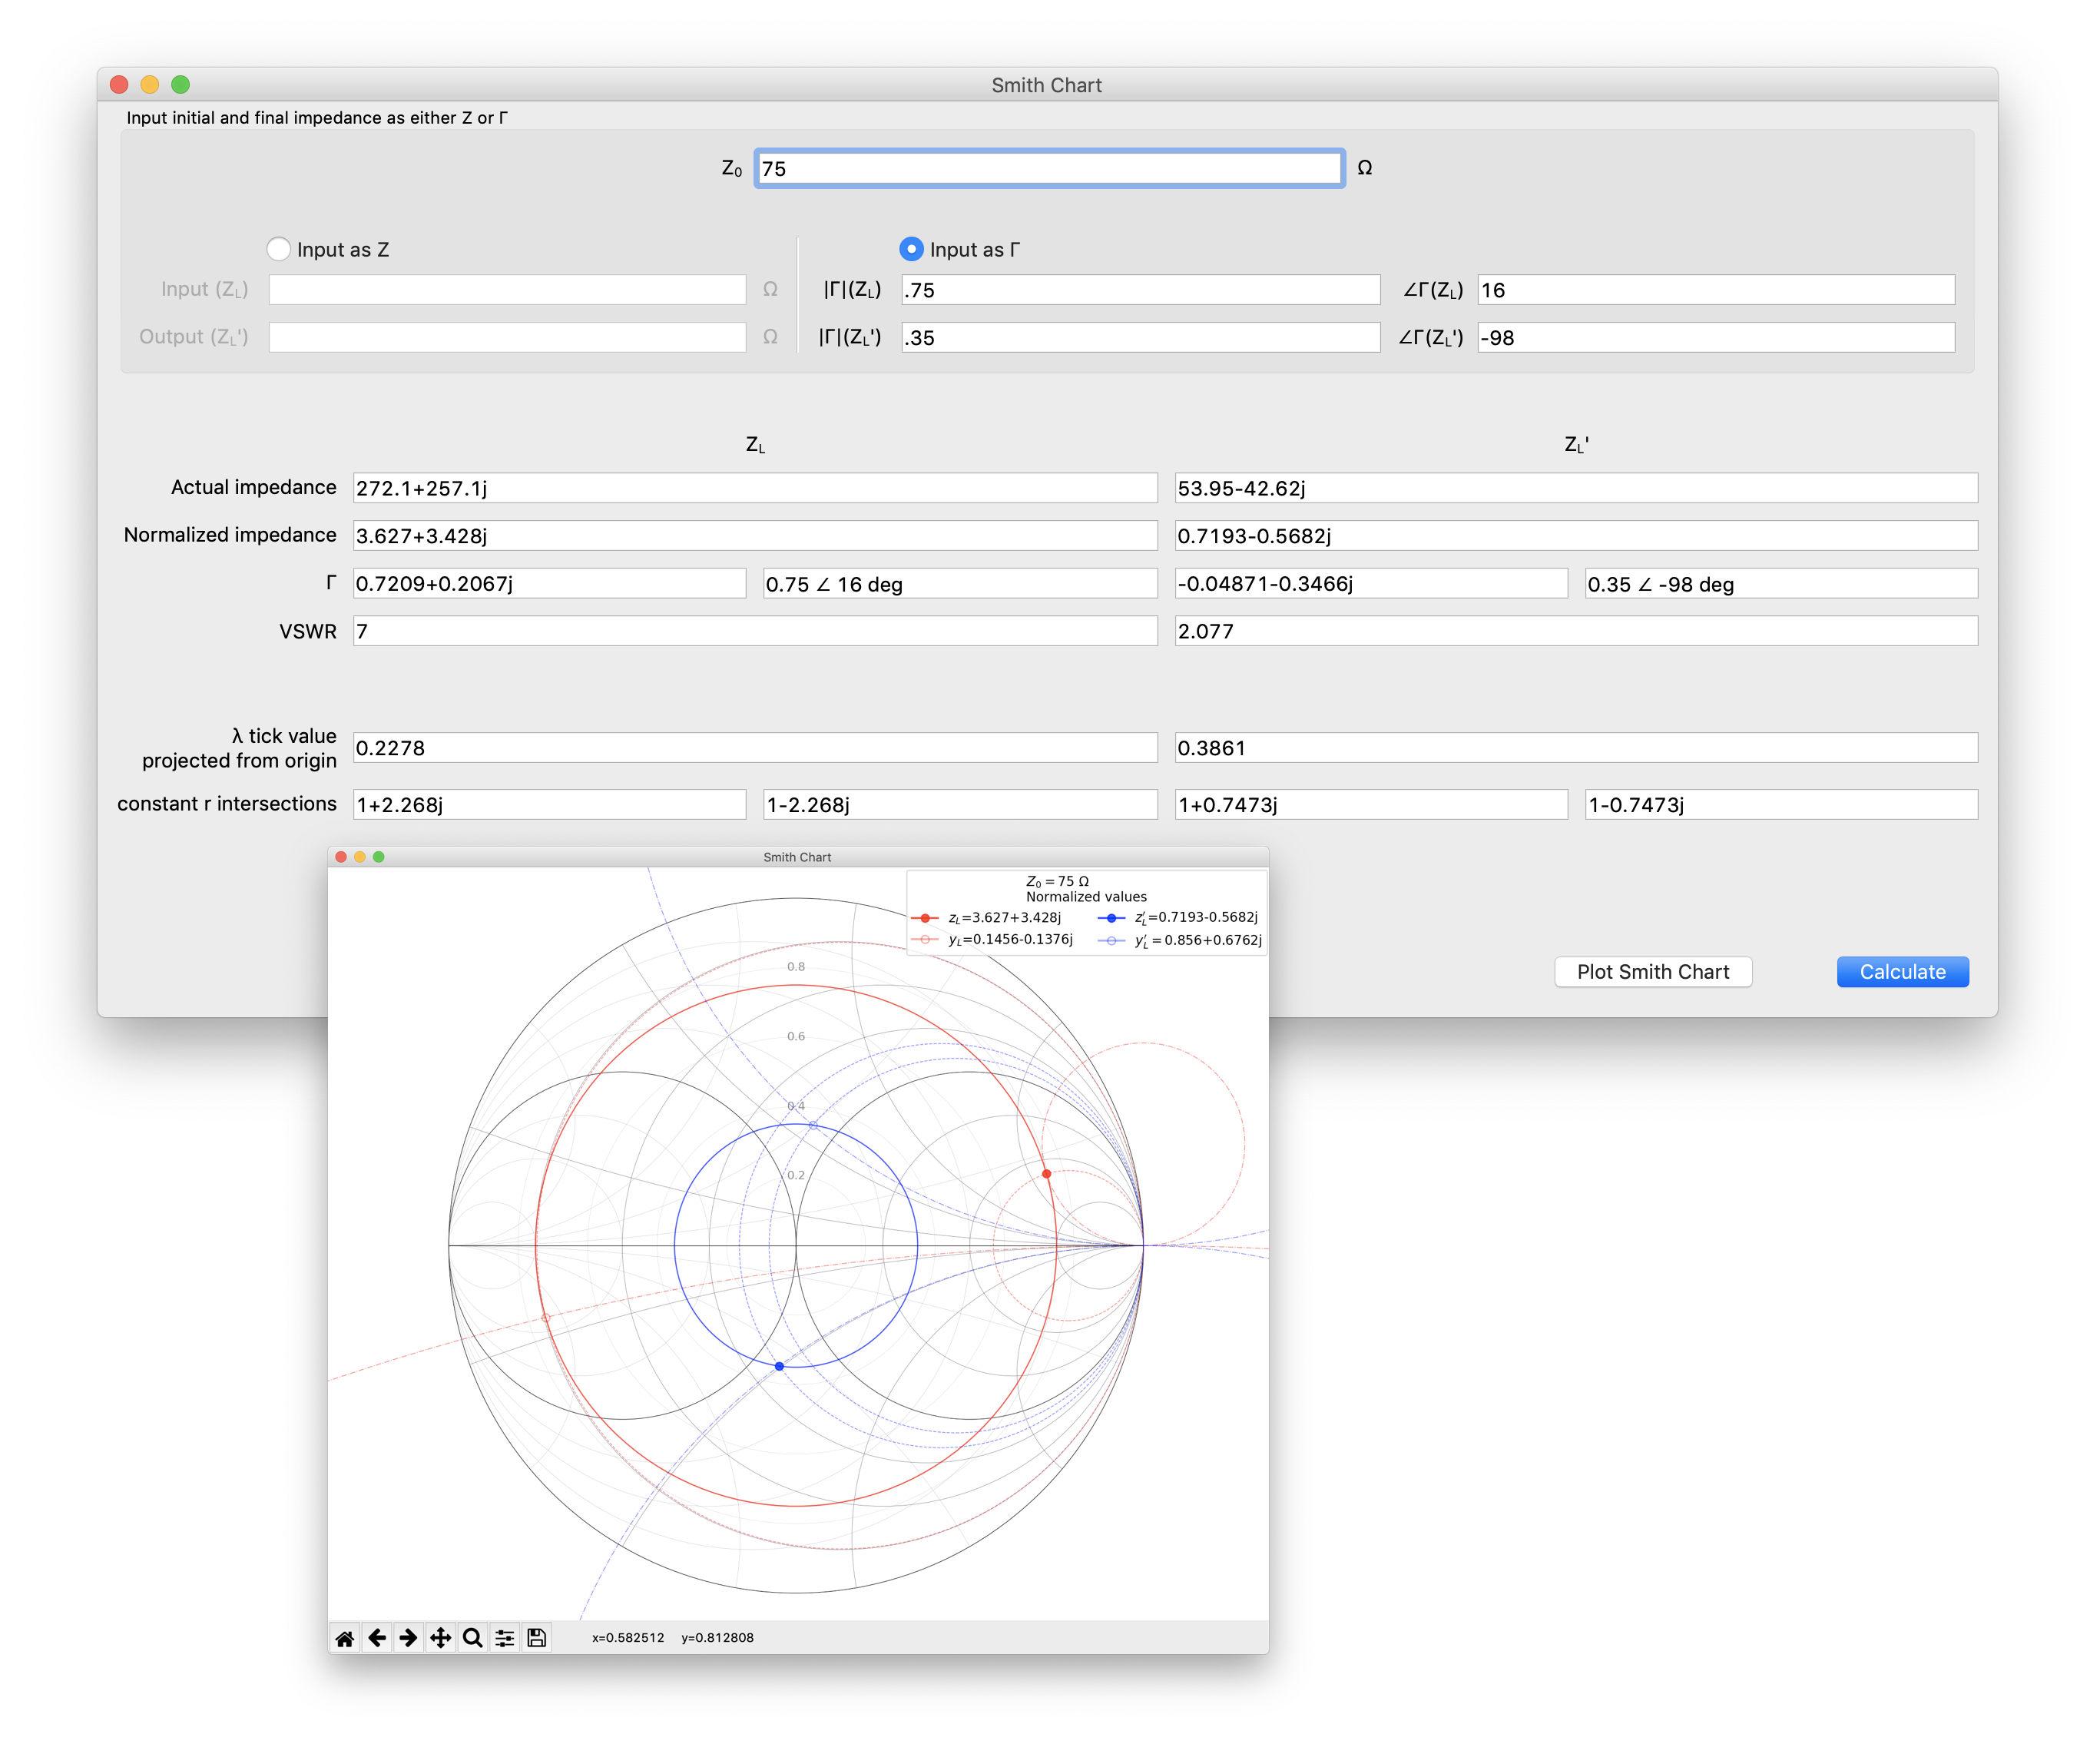
Smith Chart
— Insert values to be shown on the Smith Chart either as impedances referred to Z0 or as Γ.
— Visualize the corrisponding λ value on the Smith Chart λ scale of the points.